

THERE are no pockets of areas of the Isle of Wight 'in colour' on the Government's interactive map — which shows Covid cases.
On zooming into the map, all the Island is white, or 'suppressed', which means numbers are so low, to put the figure may identify those with Covid.
Yesterday, just two clusters showed up as green, and these were the Sandown and Brading area, and Newport Central combined with Parkhurst West.
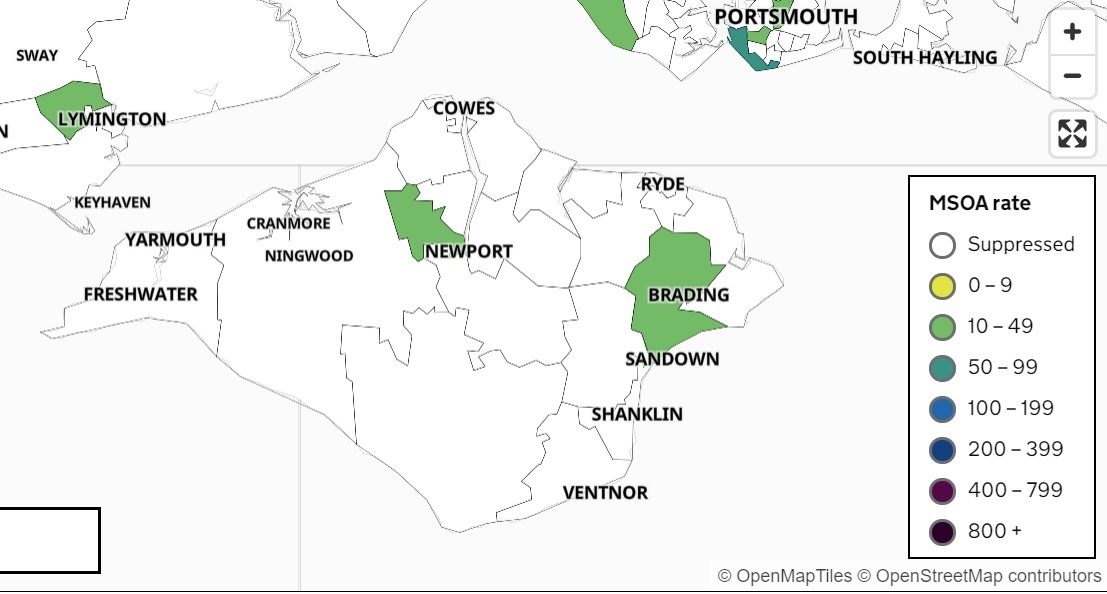
Data from April 19.
The map is even more positive today, with all areas showing white, showing no clusters of cases in any areas.
On scrolling out to see the Isle of Wight as a whole, it is yellow, with 9 cases in total, and a rolling rate of just 6.3 per 100,000 people. The map data is five days behind — showing the seven days up to April 15.
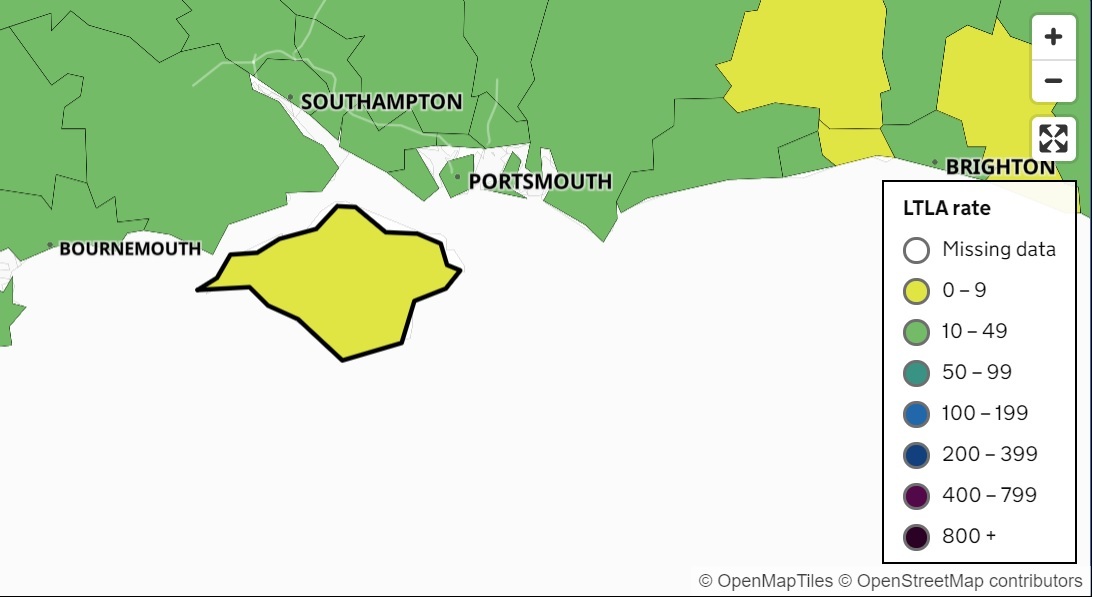
Map showing the Island is yellow, with a Covid rating of 6.2 per 100,000 people.
The Island is well below average compared to the UK, and is one of the better areas for Covid case numbers.
The map, using data from Public Health England, breaks down the number of coronavirus cases into neighbourhoods called 'Middle Super Output Areas' (MSOAs), which are smaller than council wards and based on population rather than geographical area.
It colour-codes MSOAs depending on their seven day rolling infection rate, with areas placed into the boundaries of suppressed (white), 0-9 (yellow), 10-49 (light green), 50-99 (dark green), 100-199 (light blue), 200-399 (dark blue), 400 to 799 (light purple) and 800 plus (dark purple).
For today's Covid cases, click here


House Rules
We do not moderate comments, but we expect readers to adhere to certain rules in the interests of open and accountable debate.
Read the rules hereLast Updated:
Report this comment Cancel